
I present here an algorithm that I developed to identify who was Jewish and who was not from among a population of immigrants who arrived in Ellis Island from the Russian Empire during the pre-WWI Age of Mass Migration. The algorithm has two main steps:
- Determine how “Jewish” was each first and last name
- Determine whether or not any given immigrant was Jewish, based on his first and last names
I explain how this algorithm works and show evidence indicating that this identification process works well.
Race or People
In the project I’m working on I measure and model the Jewish migration to the United States in the pre-WWI period. To do that, I am using data on 2.33 million immigrants who arrived from the Russian Empire during 1892-1925, passed through Ellis Island, and whose immigration records were kept and coded a century later. Ellis Island begun to operate in 1892, and within a few years it became the site through which the overwhelming majority of European immigrants entered the United States. Starting July 1898, the immigration authorities in Ellis Island (and since 1903 in other ports of arrival) begun requiring that shipping companies add to the passengers lists they had to submit an identification of the “race or people” to which each immigrant belonged, in addition to the previously required “nationality” field recording the country of origin.
The image shows the list of 40 ethnicities that were printed on the back of the standard forms to assist the clerks in the identification process. There was some arbitrariness in the categorization. The Swedes, Norwegians, and Danes were all grouped under “Scandinavians”. But Scots and Welsh were supposed to be noted separately from the English, and so were Moravians from Bohemians. Noticing fine, almost non-existent differences between closely related ethnicities was a routine task.
 Jews, written as Hebrews in the more politically-correct title of that period, stood out as one of 40 officially classified ethnic and racial groups. The clerks of the shipping companies were expected to understand that a Jewish immigrant coming from Russia should be written as Nationality: Russia and Race or People: Hebrew. It may not be obvious today, but it seems that at least for the case of Jews coming at that time from the Russian Empire (as opposed to, say, Germany), it was not too difficult to recognize that they were ethnic Jews and not Poles, Ukrainians (written as Ruthenians), Lithuanians, Finns or Russians. In the 1897 Russian census, 98 percent of Russian Jews reported their native language to be Yiddish, and the instructions specified that the language should be used as one of the indicators for an immigrant’s ethnic group. Besides, constitutional legitimacy notwithstanding, there was a practice of simply asking for the religious persuasion.
Since a very large share of European immigrants – over 10 percent – were East-European Jews, the clerks should have been very well familiar with this issue and been able to recognize the Jews and their Yiddish language. That must have been a piece of cake compared to, say, their duty to distinguish between seven of the Balkan nationalities of the later-former-Yugoslavia (Bosnians, Croatians, Dalmatians, Herzegovinians, Montenegrins, Servians [sic!], and Slovenians – what was to be done with the Macedonians, I do not know, but an Albanian category that had been used and removed early on was added again in 1936.)
In fact, the same instructions on the back of the forms used the example of the Jews to explain the difference between nationality and race-or-ethnicity (“An alien who is Irish, German, or Hebrew by race might properly come under the heading of United Kingdom or any other country by nationality”.) A few challenging cases were specified: “Negroes” should not be listed as Cuban or West-Indian but as “African (Black)”, regardless of national origin; Spanish-American were only “people of Spanish descent”.
A special comment explained in detail how to distinguish between “Italian (North)” and “Italian (South)”, a distinction that had existed up until 1936, and was probably removed due to pressure from Mussolini’s Government. I know that this is still a sensitive and disputed issue, and my experience is that every Italian living between Milan and Rome tends to set the dividing line tangentially to the southern boundary of his own hometown. According to the official forms, the South started way up north, “south of the basin of the River Po (i.e., compartments of Liguria, Tuscany, Marches, Umbria, Latium, Abruzzo, Molise, Campania, Apulia, Basilicata, Calabria, Sicily, and Sardinia).” But as for the Jews, the second-largest group among the immigrants of that period (after the southern Italians), apparently no need was found to explain difficulties relating to their identification.
In fact, some Jews felt offended and discriminated by this list. As few of them saw it, they were singled out as the only religion-based category. The same list was later meant to be the basis of a new question in the 1910 census, a proposal that was struck down not least due to strong opposition on behalf of Jewish organizations. The debate around it brought forward the question of what were the Jews: a race? a religious group only? a people? The Hebrew category in the immigration records was maintained for decades, and was only removed in 1943. For further reading on the creation of that list and the debates around it, I refer the interested reader to Joel Perlmann’s paper Race or People: Federal Race Classifications for Europeans in America, 1898-1913.
So the important thing for my purpose is that Jews were easily identified and matched to an official category. That should be useful for my purpose, since I want to be able to identify who is a Jew from among the Russian Empire immigrants. However, at first site, it is apparent that in practice the identification was less than perfect. During 1899-1914 only a third of the 1.234-million Russian immigrants were identified in the manifests as Jews, whereas according to the official figures, their share should have approached a half. The official figures were based on the data that was processed by the authorities, the ship manifests being a supporting document, but it doesn’t seem that the final official identification of Jews severely under-identified them.
Moische Score: Either Fail or Almost Perfect
A simple eye-ball examination of the data reveals that too many persons whose names leave no doubt as to their Jewishness were not identified as such. For example, in the year 1900, when the requirement to record the ethnicity was still new, from among 266 Russian immigrants called Moische only 13 were recorded as Jews, whereas 266 out of them were Jews (yes, this is a made-up figure, but it is also a correct one).
By 1904 identification has improved, and 980 out of the 1,074 Moisches (91.25 percent) were written as Jews. But the clerks did not keep up with this high standard, and throughout the remaining period up until WWI their Moische score stood at 87.62 percent. Similar statistics such as the Jankel score and the Mendel score show the same pattern: very low early in the early period and rarely exceeding 90 percent at any given year.
However, I found that this imprecision in the identification of Jews was mostly due to the fact that many ships simply did not identify Jews at all on their submitted manifests. If I ignore those ships, I find that the Moische, Jankel, and Mendel scores and their like, within ships that identified at least a single Jew are around 94-95 percent (see more details in my previous post on Most Common Jewish Names). This means that there was practically no problem of sloppy identification: Jews were either close-to-perfectly identified, or not identified at all, depending on the ship aboard which they had arrived. Also, there were very few false positives; based on the names which were clearly non-Jewish, I estimate that at most 0.5-1 percent of non-Jews were identified as Jews in the data. I believe that this residual was mostly due to errors that fell in processing of the data rather than due to clerks who believed a non-Jew to be a Jew.
An Algorithm
The goal is to establish some procedure, a simple algorithm, that could be employed automatically by a computer script and determine, first, how Jewish was each name, and second, how likely was each person to be Jewish based on his first and last names. Now I have something useful to work with. I can use the names distribution within the ships that have identified at least a single Jew to perform the first step of the algorithm and relate a measure of Jewishness to each first and last name.
The way to do that is fairly simple. For each name, I assign as the measure of Jewishness the share of immigrants holding it that were written as Jews. For example, throughout the period there were 662 persons called Rachmiel, of them 526 were recorded as Jews, 79.5 percent. But narrowing the view to the ships that had reported at least one Jew, this ratio becomes 95 percent, the measure of Jewishness of the name Rachmiel. Not surprisingly, the measure shows this name to be perfectly Jewish, considering that the normal rate of under-identification of Jews within ships that did report at least one Jew was on the order of 5-6 percent.
The same can be done with family names. For example, there were 288 persons whose last name was Berenstein on ships that identified Jews. Of them 274 (95 percent) were identified as Jews. The 13 year-old Rachmiel Berenstein, who arrived in Ellis Island on September 7, 1908, can thus be safely identified as a Jew based on either his first or his last name, regardless of whether or not he was written as a Jew (he was). And the same goes for the 7 year old who was recorded by precisely the same name on December 23, 1913.
Step (1): Determining the Jewishness of Names
Names Distribution – All Ships
As a first step, I count the frequency of Jews within each first and last name. I only pick names that appear at least 10 times, to reduce the chance that the sample distribution is affected by a few errors. Quite naturally, given the challenges of writing the names consistently, most names appeared less than 10 times – of 766-thousand different family names, only 27,747 appeared more than 10 times. But the average number of occurrences for a name that occurred at least 10 times was 38.4, and so in this sample more than one-million immigrants had a family name that was sufficiently frequent to be included in the analysis. For the moment, I will set the rare names aside, but I will address them later on.

Consider first the figure above: all 27,747 last names occurring more than 10 times are grouped into bins. The higher the bin, the more last names are represented in it. The bins are arranged according to the Jewishness of the last names, based on all ships, including those not identifying Jews. The leftmost bar is the highest, indicating an accumulation of many last names among which less than 5 percent of their carriers were non-Jews. In fact, almost all of these names were perfectly non-Jewish.
That is a good start. But ideally I would want to see two accumulations, one on the left, with only non-Jewish names, and one on the right, with only Jewish names. If that were the case, it would be straight-forward to tell that all the names on the right are perfectly Jewish and all those on the left are not.
Unfortunately, the picture is more complicated than this. While there seem to be many perfectly non-Jewish names, there is no clear accumulation on the right, meaning that very few family names are unmistakably Jewish. As I will show later, this is largely due to the fact that I am also including ships that did not identify Jews. If you wonder why there is an asymmetry here, it is because there is asymmetry in the misidentification: every immigrant is presumed gentile unless proven otherwise. Non-Jewish names will still show as perfectly non-Jewish, because almost no-one carrying them will be written as a Jew. But when a name is Jewish, it will show as mixed, as many Jews will go unrecorded as such.

The next figure is constructed in a similar way, but this time each bin includes a first name. Since first names go by gender, I separate the females from the males, such that if the same name appeared among both genders it will show up here as two distinct names. Before looking at the figure, there is already one important difference when compared to last names: there were far fewer first names, 204-thousand, and on average more immigrants carried each name. The 11,928 names occurring at least 10 times occurred, on average, 183 times. This means that almost 2-million out of the 2.33-million immigrants were recorded under sufficiently frequent names. This gives hope that first names will provide a more accurate source of information when identifying ethnicity.
As before, there is an accumulation on the left, with many names clearly showing up as perfectly non-Jewish. The right side of the distribution looks somewhat better than with last names: there is a hump apparent around the 75-percent mark. These are probably the typically Jewish names. But there is still a lot of noise. Let’s remove it.
Names Distribution – Ships that Identify Jews
Doing the same exercise, but only over ships that did identify at least a single Jews, shows a distribution that looks much more like the desired double heap:

Now the major source of under-identification of Jews has been removed, many of the last names that were spread rather uniformly over the entire range have moved over to the right, revealing themselves as Jewish names. And with first names, it looks even better:

Note that there were very few names in the middle ground, meaning that the separation between Jewish and non-Jewish names was definite, with a minority of ambiguous cases. Also note that the peak of the right heap is centered around 95 percent. As I show later, this is because among the ships that identified Jews a small number still did not fulfill the task perfectly.
Capturing Rare Names Using Soundex Matching
Now, I go back to the problem of rare names. In very rare cases, these are names that are singular, or almost singular. For example, Dembareindiger is a family name that appears just once, and there seem to be no other similar names. But almost always when a name appears only a few times, it is easy to find other occurrences of the same name spelled in different variants.
The Soundex transformation will group many similar variants into Soundex groups that are large enough to allow for safe statistical inference. Soundex algorithms translate words (in this case, names) into codes. Each code may have several different variants of names coming under it. Ideally, each code captures variants of only one name. In practice, that doesn’t necessarily happen, but it is not always far from it.
I use the Daitsch-Mokotoff Soundex system, originally designed for Jewish genealogical research, and for which I wrote a script on STATA implementing it. You can read here on the improvements it offers over the commonly used NARA Soundex system. I preferred not to use the more advanced Beider-Morse Phonetic Matching algorithm that is better in removing irrelevant cases, because its mapping is ambiguous, often matching one name to several codes. You can read about this algorithm here and experiment with both algorithms here.
For example, consider the Hebrew male first name Mordechai. It appeared in dozens of different variants and spelling within the population of immigrants. Most prominently are the two Yiddish variants Mordche (2,592 cases) and Morduch (856 cases). But then there are many idiosyncratic spellings, sometimes due to different pronunciations, often due to different transliterations. In fact, the proper transliteration from Hebrew Merdechai appeared only 9 times. Others are Mordiche, Mordush (7 cases), Mordch (6), Mordchai, Morduche (5), and the list goes on and on with many Mordecahis who did not share the spelling of their names with a sufficient number of immigrants. The Daitsch-Mokotoff Soundex algorithm groups those hundreds of Mordechais under the code 6934, indicating that the first letter is one of the vowels N or M, followed by R, then by D or T, and ending with a consonant such as C, CH, S, SCH,SH, CH, and so on.
Eyeballing the list of cases falling under code 6934, it appears that there are very few non-Mordechais in it. So this is an example of a name that is properly captured by the Soundex algorithm. And indeed, 94 percent of the males appearing under Soundex code 6934 are Jews. This is as good as it can get. Now the algorithm identifying Jews can use this proportion and safely deduce that each of the immigrants in this group is almost certainly Jewish, even if the specific spelling of their name is very rare. But not all cases come out so neatly, and there are many Soundex codes that group more than one name under them, they may not be as useful.
To get an impression of how well the Soundex coding works, consider the distribution of the Jewishness of last-name Soundex codes:

This doesn’t look too great. There is an accumulation of non-Jewish Soundex codes, but all the rest are distributed all across the range, with only a few family name codes that can clearly be deemed Jewish. While it provides some information, it is noisier than the information provided by the actual spelling of the names. The distribution of the Soundex codes of first names over genders looks somewhat better, but it is still not as good as the distribution given by the actual names:

Step (2): Determining the Jewishness of an Immigrant
The distributions that were shown above refer to names, not to people. We saw that there is a general pattern in which many names are typically non-Jewish, others are typically-Jewish, with a minority falling in between. But it may be the case that the names that are clearly associated with being Jewish or non-Jewish are very rare, and that in practice, most Jews carried more ambiguous names. Fortunately, it turns out that the opposite was true: Jews strongly preferred Jewish names, and ambiguous names were picked by only a minority.
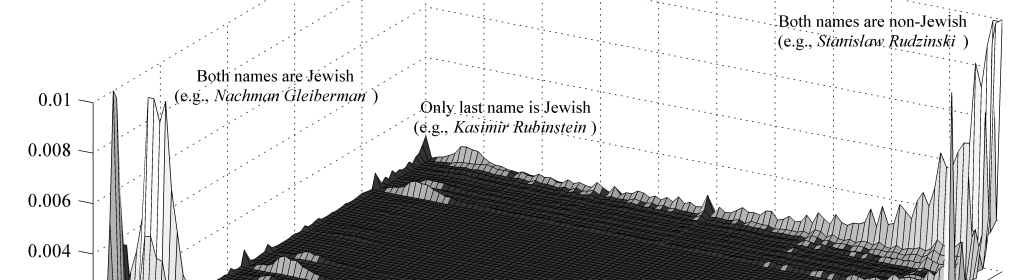
The following figure is dense with detail and requires some explanation, but it reflects the big picture with its main patterns (click the image to see the fine detail in a separate window). Of the 2.33-million Russian immigrants, there were 847,900 whose first and last names were both common (i.e., each appearing at least 10 times in the sample). I position them over a grid according to the Jewishness of their first and last names, where the Jewishness measure is only based on ships that identified at least a single Jew. The grid is divided to 10,000 squares, where one axis represents the Jewishness of the last name, and the other the Jewishness of the first name. For example, the first square on the far right captures all immigrants for whom both the first and last names were under one-percent Jewish. The square on the far left has immigrants whose both names were over 99-percent Jewish. The height represents the fraction of immigrants within each bin. Since there are 10,000 squares over the grid, an average square has 1/10,000 of the population, and so a square whose height is 0.01 is 100 times denser than average.

The most striking feature is that there are two clear accumulations of immigrants. The concentration at the far-right represents a mass of immigrants with both non-Jewish names, whereas at the left are immigrants with both names Jewish.
For example, you can find on the far-right eight immigrants named Stanislaw Rudzinski, all of whom arrived in ships that identified Jews – yet none of them was identified as Jewish. The Jewishness of the first name Stanislaw was 0.687 percent, meaning that hardly one in 150 male Stanislaws was recorded as a Jew within ships that identified Jews. The last name Rudzinski was 1.942-percent Jewish. This last name exemplifies how even the particular spelling of the names can become useful: an almost identical name, Rudinsky, was 76.67-percent Jewish. And so, even when Jews were using last names that were wholly Slavic, they may still have spelled or pronounced them differently from non-Jews. What really discloses the non-Jewishness of immigrants named Rudzinksi is the spelling of the Polish consonant dz, which is not used in Yiddish.
In the left cluster there is, for example, an immigrant called Nachman Gleibermann. His first and last names were 94.1 percent and 95.7 percent Jewish respectively. In both the cases of Stanislaw Rudzinski and Nachman Gleiberman, we can safely predict who was and who was not a Jew.
That the majority of the immigrants are concentrated in one of the two corners is very encouraging, and in fact, the extent of this concentration is somewhat obscured by the fact that there are a few squares at the corners of the grid with truncated tops. More than 62-percent of immigrants with frequent names represented in the figure are either at the left Jewish corner (with both names over 85-percent Jewish) or at the non-Jewish corner on the right (with both names under 15-percent Jewish).
Furthermore, it is also evident from the figure that most cases away from the corners represent immigrants whose first names identify their ethnicity clearly, with only their last names being ambiguous. These are the immigrants that are found along the two “ridges”, one along the 95-percent line of the Jewishness of the first name, and another around the zero-percent line of the Jewishness of the first name. There are no similar orthogonal ridges along the lines representing the Jewishness of the last names. This reflects the pattern that was already noted above: first names are less ambiguous than last names.
To get an idea of how useful it is to use the Soundex matching when one of the names are too rare, the following figure reports a similar distribution along a 10,000-square grid that is aggregated by Soundex codes.

It is clear that the distribution of Soundex codes is not as conveniently arranged as that of the actual names. The distribution of codes of family names is still skewed toward the edges, but it is evident that it includes a lot of noise. However, there appears to be less noise in the distribution of first names Soundex codes, and there are still two main concentrations, one along zero-percent and one along the 95-percent. So in cases in which the names are rare, there is still hope of getting useful information from the Soundex code of the first name, and some, though not much, from that of the last name.
Predicting Who Is a Jew
After measuring the Jewishness of each first and last name, and of their Soundex codes, I now use the following algorithm to predict whether or not each individual is Jewish:
- If the first name appears at least 20 times, and the first name is at least 85-percent Jewish, then mark the immigrant as a Jew.
- If not yet marked, then if the first name appears at least 20 times and is under 5 percent Jewish, mark as non-Jew.
- Repeat steps (1) and (2), but with last names.
- If not yet marked, then if the sum of appearances of first and last names. is at least 40, and both names are over 75-percent Jewish, mark as a Jew.
- If not yet marked, then if the sum of appearances of first and last names is at least 40, and both names are under 15-percent Jewish, mark as a non-Jew.
- If not yet marked, repeat steps (1)-(5) with more lax thresholds of minimum and maximum number of immigrants in the name group and the levels of Jewishness of the names required for marking as a Jew or non-Jew.
- If not yet marked, repeat steps (1)-(6) using the Soundex codes instead of the names.
- If not yet marked, mark as non-Jew.
Note that the minimum times of appearance is only in reference to occurrences in ships that identified at least one Jew. The asymmetry in the levels of threshold (e.g., 85 vs. 5 percent) follows from the asymmetry in the misidentification discussed above. While using the measures of the Jewishness of names, I make a simple adjustment: given that persons from the same household often arrived together on one ship and were recorded sequentially in the manifests, I want to avoid using the actual identification of the immigrant or any of his household members when making an inference on his ethnic status. Households were typically identified as a unit – the head of the household aboard the ship (father, mother, older sibling) was assigned an ethnicity, and the identification of the rest was fast-tracked. To make the identification depend only on each immigrant’s names without relying on his actual registered ethnic status, I calculate the Jewishness of his names only based on all other ships that reported at least one Jew, and ignore his own.
Quality of Prediction
So how well does the algorithm work? There is no definite way of knowing, since the problem was to begin with that we do not know for sure who was and was not a Jew. But we can get some useful hints. For each ship that had at least 50 immigrants from Russia and which identified at least a single Jew aboard, I compare the proportion of Jews among Russians according to the records versus their share aboard the ship according to the predictions of the algorithm.
To do that I form a grid which along one dimension has the recorded share of Jews among Russian immigrants aboard each ship, and along a second dimension the predicted share. The grid is partitioned into 50 sections along each dimension, forming 2,500 squares in total. The height of the bar rising from each square represents the number of ships for each bin of recorded and predicted share of Jews. If the prediction is identical to the records, then all ships will be arranged along the 45-degree line. Also, even if there are some deviations of the prediction from the records, but the deviations are not biased one way or the other, then we should still expect ships to align along the 45-degree line.

And this indeed happens almost precisely: the accumulation of ships along the 45-degree line means that almost all ships that recorded at least one Jew, practically ended up recording the same share of Jews as predicted by the algorithm, possibly undershooting it very slightly. Note that there are almost no ships at all to the right of the line, meaning that the actual registration did not exceed the prediction. But there are quite a few ships to its left, meaning that there was under-registration of Jews in those ships. To see how sharp this line is, here is a top view of the same figure:

The fact that the line is so sharp strongly suggests that there is a systematic pattern. There is no proof here, but this pattern is very consistent with the following: most ships identified Jews very accurately. The algorithm also identifies Jews quite accurately, and at least with no bias, in the sense that to the extent that it produces inaccurate identification, it does not systematically over- or under-identify Jews. Some ships, a minority, identified Jews but did so poorly, in the sense that they failed to record many Jews as such. These are the ships that appear on the left of the line in the two figures above. All along, I could find no evidence of ships that erred the other way, identifying more than a tiny fraction of non-Jews as Jews.
Finally, here are the outcomes of the counting of Jews I preformed. Of 1.768-million Russian immigrants aboard ships that identified Jews, the algorithm predicts the same status as the one recorded in the case of 1.595-million (90.24 percent) of them. There were 98,363 immigrants that were registered as Jews, but were not identified by the algorithm. In most likelihood, except for a small fraction these were indeed Jewish immigrants missed by the algorithm. There were an additional 74,228 immigrants predicted to be Jewish but not registered as such. It is conceivable that many of them were indeed Jews, probably from the minority of ships that performed poor identification, but it is hard to tell how many of them were indeed Jewish.
Most importantly, we can now see what the algorithm says about the 565-thousand Russian immigrants that came aboard ships that did not identify any Jews at all. It turns out that 217,843 of them, 38.55-percent, are predicted to have been Jews. This is less than their share among the ships that did identify Jews, which stood at 43.23-percent, but not by much. So it looks like some of the ships that did not identify Jews simply had few or none; but clearly many of them had as many Jews as other ships, yet simply failed to record that fact.
Altogether, the algorithm identifies 982,373 of 2.33 million (42.1-percent) of the Russian immigrants passing through Ellis Island in the years 1892-1925 as Jews.

Leave a comment